Understand Gage R&R

Any quality professional worth his keep knows that gage repeatability and reproducibility (R&R) studies are a critical part of a successful process control system, but it is amazing how many do not understand how to properly conduct a study or how to interpret the results.
Quality professionals know that measuring manufactured products is critical to maintaining the customer specification. They also know that measuring products is necessary for statistical process control systems designed to improve the manufacturing process itself. What is sometimes forgotten is that the data is only worthwhile if the measurement system itself is adequate.
A gage R&R study will tell operators if the measurement system is acceptable for its intended use. The gage study also shows which part of the measurement system is contributing the most to the variation of the measurements and helps operators plan improvements to the system.
Related Reading
Measurement systems contain variation from three main sources: the products themselves, the appraiser taking the measurements and the equipment used to perform the measurement. The gage study shows the contribution of each of these areas.
In an adequate measurement system, one would expect to find most of the variation within the products. If the bulk of the variation is created by the appraisers or the equipment, then the system may not be suitable.
Conducting the Study
The gage study consists of several parts that are repeatedly measured by multiple appraisers. While the numbers can vary, most studies use 10 parts and three appraisers who measure the parts at least three times each.
The repeated measurements are called trials. Calculations are then made to determine the level of variation between the appraisers, parts and across the trials. It is not necessary to go into the actual calculations here since there are numerous software programs and templates available to assist operators. Instead, let’s focus on how to perform a valid study and how to interpret the results.
Selecting part samples is perhaps the most critical step in performing a successful study-and probably the most misunderstood. Part samples used for gage studies should represent the true variation of the production process. A common mistake is trying to select production samples that are similar. Some instructions for gage studies even state that samples must be from the same batch.
The truth is that using products that do not represent the variation of the process will cause the gage study results to be worthless. If necessary, operators may even select samples over a period of days or weeks to get samples that truly represent the process. Always remember that it is the measurement system that is being evaluated here, not the products.
Now it is time to start measuring. Here are a few guidelines for the measuring process:
- The operators should share one calibrated gage or measurement system.
- Five or more samples that represent the range of the process variation should be used. Do not use one part or parts that have little variation.
- Samples should be measured in random order if possible.
- There should be at least two trials or measurements taken from each operator.

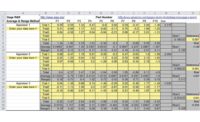
Figure 2. The average and mean report includes not only the measurements and calculations, but also a graph charting the appraiser results. This chart is useful in pinpointing appraiser training or method issues. Source: InfinityQS
Evaluating the Gage Study
Let’s take a closer look at the various reports used to evaluate the gage study.
The TV Report
The total variation (TV) report analyzes the gage study data as a percentage of total variation. The report is divided into sections presenting the equipment variation, appraiser variation, part variation and the gage R&R.
Equipment variation (EV) represents the repeatability of the equipment or measurement device. On the TV chart, it is presented as a percentage of the total variation of the system. See Figure 1. The equipment variation percentage is 17.6% of the total variation of the system. While the result in the example is low, a high percentage, greater than 30%, would tell operators that they have issues with the measurement equipment itself that must be resolved. The gage may need maintenance or perhaps the fixture holding the part for measurement is not adequate.
Appraiser variation (AV) represents the reproducibility of the system. The TV chart also reports the AV as a percentage of the total variation of the system. A high percentage here, greater than 30%, indicates a large operator-to-operator difference. A possible cause could be operators not following proper measurement procedure, not trained properly or perhaps trained in different methods.
Part variation (PV) represents the variation of the products or parts used to conduct the gage study. In the example, the PV% is 96.4%. One would expect to see a high percentage of the total variation from the parts on an adequate system where the parts truly represent the range of the process variation. If the PV% is low, less than 30%, the parts selected do not represent the full variation of the process.
Gage repeatability and reproducibility (GR&R) represent both the equipment variation and the appraiser variation. The GR&R% returned in the TV report is the percentage of the total variation of the system used by the measurement system. In Figure 1, GR&R% is 26.7%. This means that 26.7% of the total variation is due to the measurement system itself. Rule of thumb for GR&R is that a result of 10% or less means that the system is acceptable. Most of the variation is from the parts and not the measurement system.
If the GR&R is less than 30%, the system may be accepted, but there should be some plan to review the system for improvement. A GR&R result of greater than 30% shows that the system must be improved as the appraisers and equipment contribute to more than 30% of the system variation.
Another critical calculation in determining if the gage study is valid is the number of distinct categories (NDC). The NDC is the calculation for the number of non-overlapping 97% confidence intervals that span the product variation. In other words, it is basically the part variation divided by the GR&R result and multiplied by a constant. The NDC should be five or greater for the study to be considered valid.
As discussed earlier, a common problem with gage studies is that the part variation does not represent the expected process variation. If the part variation is too small, then the NDC will be below five and the study should not be considered valid. In this case, operators may sample again to obtain parts that do represent the full range of process variation. Remember to evaluate both part variation and gage R&R. If the gage R&R itself is too large, then the NDC will be low as well. If this occurs, operators could have an issue with AV, EV or the measurement system itself.
When evaluating the TV report results, remember that these results are calculated against the process variation only. In the example, the GR&R% is 26.7% of the total variation. This report shows which section of the measurement system may need improvement, but it does not show how the system works within the actual tolerance of the parts. To evaluate the measurement system against the tolerance, one must use the total tolerance report.
The TT Report
The total tolerance (TT) report analyzes the gage study against the production tolerance of the part that the system is being evaluated to measure. While the categories are the same (EV%, AV%, GR&R% and PV%), the results are percentages of part tolerance. If the system is being evaluated for a particular purpose, then this report gives a true understanding of whether the measurement system is adequate.
If the study is to determine if a measurement system is adequate for a specific purpose, then the results should be evaluated as a percentage of tolerance and the total tolerance report should be used.
The Average and Mean Report
The average and mean report includes not only the measurements and calculations, but also a graph charting the appraiser results. See Figure 2. This chart is useful in pinpointing appraiser training or method issues.
Average and mean charts should not be read as a control chart. The data is plotted by sample number and not time sequence. Each chart plots the mean of each sample part and the range of each sample part by operator. In the example, one can tell that all operators have similar averages on all 10 parts; however, the second operator, Justin Thom, has much more variation on each part. The next step here would be to determine if Justin is following the correct procedures or if he has been properly trained.
Understanding how to properly conduct a gage R&R study and how to interpret the results is a key skill for quality professionals. For more detailed information, consult AIAG’s Measurement Systems Analysis, third edition, 2002, and Evaluating the Measurement Process, Wheeler and Lyday, 1984. Q
Tech Tips
Here are a few guidelines for the measuring process:
- The operators should share one calibrated gage or measurement system.
- Five or more samples that represent the range of the process variation should be used. Do not use one part or parts that have little variation.
- Samples should be measured in random order if possible.
- At least two trials or measurements should be taken from each operator.
For more information on gage R&R, visit www.qualitymag.com to read the following:
Looking for a reprint of this article?
From high-res PDFs to custom plaques, order your copy today!


