For one supplier of leaf springs for golf cars and other applications, the manufacturing process starts with high-carbon, high-alloy spring steel that comes in 22-foot bar lengths from the mill. Rockwell American Manufacturing Co. (Seagoville, TX) employees cut the bars to various lengths, punch them for brackets and fasteners, and install connecting hooks to some. Next, the bars are heat-treated and formed in a single operation. The spring leaves then are quenched, mated to others in final assemblies and painted. The company's spring assemblies weigh from five to 80 pounds each and also are used for applications in the utility trailer and heavy trailer markets.
On a daily basis, a number of springs are tested on fatigue testing machines to ensure that they meet Rockwell American's customers' requirements for expected life, as each spring assembly part number has a different load rating and a different life expectancy. The test system's goal is to vary the force applied to the spring assembly in a continuous sinusoidal manner between minimum and maximum loads while accruing cycle counts. Most of Rockwell's testing machines can fatigue test approximately three spring assemblies a day by flexing the assembly by about 50,000 cycles. This ensures that the production parts meet endurance specifications.
In some of Rockwell's older spring testing machines, the springs are flexed by a hydraulic actuator controlled by a closed-loop servo driver card that receives inputs from a sine wave generator and a load cell, allowing the operator to generate and monitor peak loads and cycle count values. The systems can execute about 60 strokes per minute while flexing the spring between one-half and one-and-one-half times its weight capacity. Once the servo driver card is tuned, the sine wave generator's amplitude and frequency are adjusted manually until peak-load values and a counter frequency-or counts per second-are reached. This manual trial-and-error process often takes 10 to 15 minutes for a test operator to set up the machine for testing a new spring.
This approach satisfied Rockwell American's testing needs in the past, but lacks the speed, flexibility and diagnostic tools the company needs to meet volume and quality goals in the future. A key catalyst that prompted investigation of new testing machinery came about when Rockwell began having raw material quality problems with one of their spring steel suppliers. They needed a "smarter," more flexible closed-loop controller for the tester's hydraulics. The plant general manager called in hydraulics experts from the Wilson Co., a Texas hydraulics distributor, who recommended the use of a Delta Computer Systems RMC100 Series electro-hydraulic motion controller in a new spring tester machine for the plant.


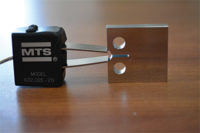
In the new system, position feedback is provided by a magnetostrictive linear displacement transducer (MDT) mounted within the hydraulic cylinder. Force-feedback is provided by a load cell mounted at the end of the piston rod. During each spring-flexing cycle test, spring deflection is performed using position control until the load cell reads 50 pounds, at which point the motion controller transitions into force-load control. As the spring continues to flex under force control, position is monitored to make sure that the spring has not broken.
The motion controller enables the tester to accurately follow an internally generated target force profile by continuously adjusting drive output to the hydraulic valve 1,000 times per second. Simultaneously, the minimum and maximum deflections are being monitored in real time during the force cycling and compared against allowable limits to determine any change in the properties of the spring. For each spring tested, these limits are found when the motion controller is commanded to enter force control, initiated by operator with the touch screen. At the beginning of the testing cycle, the system compresses the spring to minimum and maximum force set points while recording and storing the corresponding minimum and maximum spring deflections. This capability was useful in helping Rockwell American diagnose and document a recent raw material quality problem.
If the position of the hydraulic actuator were to exceed operator specified tolerances during the continuous force-control cycle testing, the spring properties may be changing, and the spring may be ready to break, or one leaf in the spring may already have broken. If this condition happens, the RMC100's continuous monitoring of position tolerances during force cycling will lead to an automatic system shutdown. Because of these controls, the machine can run continuously with a minimum of supervision. The new machine also is capable of capturing and plotting test data for post-test diagnostics and record-keeping.
The bottom line: With its motion control, the new tester can test twice as many springs and provide useful testing diagnostic tools, while improving test repeatability and reliability compared to the older machines. And because Rockwell American engineers can set up and test products more quickly than before, the new machine also will help expedite the company's new product development process. NDT


sidebar:Key Motion Parameters vs. Time
A portion of a continuous motion profile plotted by a motion control software package is shown. The sample plot shows the motion controller controlling the actual force being exerted on the spring as it is flexed to follow the sinusoidal target motion profile with a period of about one-half second. The vertical axis on the plot represents the magnitude of a signal and the horizontal axis represents time.The plot was taken early in the system tuning process, allowing for a clearer view of the force control with the actual force curve, shown in purple. This closely matches the sinusoidal target force curve-shown in teal-that is generated within the RMC100. An optimally tuned system typically will have the actual and target curves overlapping completely.
The graph also plots actual position of the hydraulic actuator, shown in red, and actual velocity of the actuator, shown in dark blue. Because the controller is in force control, the gray legend box shows the actual target positions and velocities to be the same, as there is no position target generated.
The cyan (light blue) curve on the graph represents the analog drive signal output from the motion controller to the proportional hydraulic servo valve. The gray legend box shows actual parameter values at the time signified by the black vertical cursor line, set at 499 milliseconds in this plot.
By consulting a plot such as this, engineers can determine what is going on in time slices as small as one 1,000th of a second-while the spring is flexing. This provides a more detailed view than is possible by observing the system visually. The plots provide an electronic or hard copy record of the system's operation as well as the ability to compile performance records for a given sample.


