Software
Quality Web Exclusive
How to Create a Culture of Quality Across the Supply Chain
May 9, 2019
Software & Analysis
There’s Nothing Artificial About AI in Quality
Articial intelligence is making its way into the workplace.
May 8, 2019
Quality Headline
Hexagon’s Manufacturing Intelligence Division Breaks Ground on New Center of Excellence
May 7, 2019
Quality Headline
Hexagon Hosts the MSC Software Global User’s Conference at HxGN LIVE
May 3, 2019
Drive Improvement with Data
Achieve greater insight into the operations and make decisions based on data.
May 1, 2019
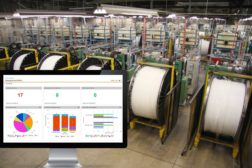
How a Global Manufacturer Prevents Defective Parts with SPC Software
Easy monitoring and actionable reporting are key.
April 30, 2019
Quality Headline
Hexagon Hosts Second Annual Production Software Users' Group Meeting at HxGN LIVE 2019
April 8, 2019
Move from “Inspect and Reject” to “Predict and Prevent” with SPC Software
A senior quality leader details his approach to making significant quality improvements.
April 2, 2019
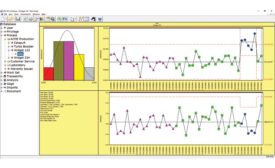
How to Statistically Control the Process
When disruptions are detected, it’s critical that operators have the tools available to quickly diagnose and correct the issues.
April 1, 2019
Stay in the know with Quality’s comprehensive coverage of
the manufacturing and metrology industries.
eNewsletter | Website | eMagazine
JOIN TODAY!Copyright ©2024. All Rights Reserved BNP Media.
Design, CMS, Hosting & Web Development :: ePublishing


