GR&R Software
The Expanded Gage R&R Study
When a standard GR&R study is not enough, try an Expanded Gage R&R.

The data collection plan for the Expanded Gage R&R includes five wafers, three operators, and three gages. Each operator measures each wafer with each gage twice. Source: Minitab

Unlike a standard Gage R&R, an expanded study accommodates missing data, as seen in Row 10 of the “Thickness” column. Source: Minitab

The analysis treats Operator, Part, and Gage as random factors because each was randomly sampled from a larger population. Including “Gage” in the study lets us determine the variability due to the gage main effect, as well as its interaction with the other two variables, Operator and Part. Source: Minitab

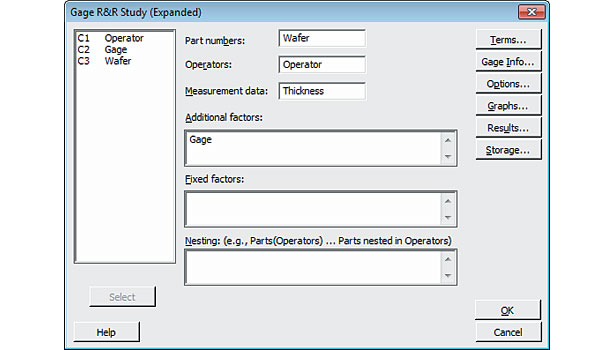
We can select the graphs we would like to evaluate by clicking completing this dialog box. Source: Minitab

The ANOVA output indicates that gage-to-gage variation, the Wafer*Operator interaction, and the Wafer*Gage interaction are statistically significant. Source: Minitab

Gage Evaluation table indicates that this measurement system just narrowly achieves Automotive Industry Action Group guidelines, and also shows the relative importance of each of the sources of variation. Source: Minitab

The main effects plot illustrates the contribution of Gage to measurement system variation. Source: Minitab

This graph illustrates the strong contribution of the Wafer*Gage interaction to measurement system variation. Source: Minitab


If you can’t trust your measurement system, you can’t trust the data it produces. That’s why Measurement Systems Analysis (MSA) is a key component of establishing, improving and maintaining quality systems. Whether you’re engaged in a Six Sigma project or an ISO9000 certification, an MSA helps you identify problems with your measurement system and determine if you can trust your data.
The most common type of MSA is the Gage repeatability and reproducibility (R&R) study. Most Gage R&R studies assess the effects of two factors on variation in your measurement system—typically operator and part.
However, the effects of operator and part frequently are not enough to provide a complete understanding of the measurement system. Adding a third variable (typically gage) to the standard study is often required.
When three or more factors are included in the analysis, we call the study an Expanded Gage R&R. In the following situations, a third factor is crucial to understanding the system.
An electronics manufacturer makes voltage regulators on three production lines, each with its own gaging system. Faced with an unacceptably high reject rate, the quality manager suspects the measurement system is at fault, but each gage has been calibrated to its own standard and passed its Gage R&R with flying colors. The manager conducts an Expanded Gage R&R that includes the three gages as well as operator and part. The calculated percent tolerance—the proportion of the tolerance that is taken up by the measurement system variability—is 79%. A percent tolerance greater than 30% is considered unacceptable. After the manufacturer calibrates the gages to one standard, rejects are virtually eliminated.
A California machine shop produces stainless steel parts to extremely tight tolerances for use in robotic surgical instruments. Customers require verification of the capability of their dimensional measurement systems. Since any measurement technician could use any of dozens of gages, a standard Gage R&R could not demonstrate capability. They did an Expanded Gage R&R, including operator, part and gage. The Total Gage R&R percent tolerance of 3% was so low that the shop was able to reduce QA sample size while maintaining the same level of quality.
Standard vs. Expanded Gage R&R
The four main differences between a standard and an expanded study are:
- The expanded study allows additional factors such as gage, laboratory and location to be evaluated in addition to operator and part.
- Unlike the standard study, missing data points are allowed in the analysis for an expanded study.
- The interactions of the additional factors with operator and part can also be evaluated.
- The sampling plan for the expanded study will quickly grow beyond a reasonable size and will require reducing the sample size of at least one variable. For example, reducing the number of parts from 10 to five is a common approach.
In the Field
An Expanded Gage R&R tool can help companies implement Expanded Gage studies to correctly assess their measurement system and improve quality.
In using Expanded Gage R&R to evaluate systems for a wide range of measurement types—from surface roughness to coating thickness—we have learned that simply running a separate standard gage R&R at each of the levels of the extra variable is rarely an efficient design for answering the questions of interest.
To help more quality practitioners reap the benefits of this powerful tool, let’s take a step-by-step look at how to design, analyze and interpret the results of an Expanded Gage R&R Study. We will use a system for measuring film thickness from the microelectronics industry for illustration.
Process and Data Collection
Photoresist coating is used in the microelectronics industry to etch integrated circuits for microprocessors, RAM, etc., onto silicon wafers. We need to assess the measurement system for the thickness of this photoresist coating. The thickness affects how coated silicon wafers perform in microelectronics, so obtaining accurate measurements is critical.
The data collection plan is outlined below:
- 5 wafers are randomly selected to represent the typical process performance.
- 3 operators are randomly selected.
- 3 gages are randomly selected.
- Each operator will measure each wafer with each gage twice.
In a standard Gage R&R plan, we would select 10 wafers at random to represent process performance. If a standard study was followed for each of the three gages, the total sample size would be:
- (10 Parts) x (3 Operators) x (2 Repeats) x (3 Gages) = 180 measurements
That is an unacceptably large sample size. By decreasing the number of parts (wafers) from 10 to five, the total study can be completed in 90 measurements.
Changing the sampling plan is commonly required to reduce the size of the Expanded Gage R&R study to a manageable level. This is an important difference between a standard and an expanded study. Later, we will demonstrate that reducing the number of parts from 10 to five did not compromise the quality of our calculations.
Entering the Data
As can be seen in the worksheet for this study’s 90-row dataset, each operator measures each wafer on each of the three gages, twice. Each row has a column that identifies the operator, gage, wafer and thickness reading. Even though missing data is not allowed in a standard Gage R&R, an expanded study accommodates missing data, as seen in Row 10 below.
To carry out the analysis, choose Stat > Quality Tools > Gage Study > Gage R&R Study (Expanded). The analysis treats operator, part and gage as random factors because each of these factor levels (e.g., each operator) was randomly sampled from a larger population. (If our measurement system had only two gages and our main goal was to compare them to each other, then our analysis should consider gage as a fixed factor, and we would identify it as a fixed factor in the dialog box.)
Next we select the terms we wish to evaluate by clicking the “Terms…” button and adding all main effects (wafer, operator and gage) as well as all second-order terms—wafer*operator, wafer*gage, and operator*gage. By including “gage” in the study, not only do we determine the variability due to the gage main effect, but also its interaction with the other two variables, operator and part. Finally, we select the graphs we would like to evaluate by clicking the “Graphs…” button and completing the dialog box.
Then click OK to close the dialog boxes, and the software will perform the analysis.
Interpreting the Results
Software can provide a great deal of numeric and graphical output. Let’s evaluate the two most important data tables first. The ANOVA table shows which sources of variation were statistically significant. Factors with p-values less than .05 in the ANOVA table are statistically significant.
The ANOVA output indicates that gage-to-gage variation, the wafer*operator interaction, and the wafer*gage interaction are statistically significant. The high p-values for operator and the operator*gage interaction indicate that these two sources of variation are not statistically significant, and therefore will not be of concern when trying to reduce the variability of the measurement system. (Wafer-to-wafer variability also is statistically significant, but since we are focusing on the measurement system, part-to-part variation is not a key concern in this study.)
It is also important to evaluate the ANOVA table for the number of degrees of freedom (an indicator of the number of repeat measurements) available to estimate the repeatability of the gage. Here we see 57 degrees of freedom, well above the 30 to 45 recommended by simulation studies. Therefore, the reduced number of parts in the study has not hindered our ability to estimate the contribution of the gage repeatability to the overall variation of the measurement system.
Next we’ll examine the gage evaluation table. The Automotive Industry Action Group has set guidelines for percent study variation and number of distinct categories at a maximum of 30% and a minimum of five categories, respectively. Here we see that both measures of capability indicate that this measurement system just narrowly achieves both of these guidelines.
The gage evaluation table also shows the relative importance of each of the sources of variation. The variation due to gage and wafer*gage are the two strongest contributors to the overall variation, each accounting for about 16% of study variation. We can see the contribution of gage to the variation in the main effects plot. The average reading by gage varies from 111 to 123 microns.
However, this is not the full story, because the wafer*gage interaction was also a strong contributor to the measurement system variation.
The general agreement seen in the three gages on parts 3 and 5 indicates that there is not a consistent bias between the three gages. However, gage 2 has a strong positive bias for wafers 1 and 4. Even though the measurement system is acceptable, determining why the gage exhibited bias when measuring wafers 1 and 4—and fixing this problem—will reduce overall variation in the measurement system.
Finally, we return to the question of the effect of reducing the number of parts from 10 to five. Our capability estimators percent study variation and number of distinct categories are a function of the part-to-part variability, which can be calculated from the parts in the study or from historical data. With only five parts, one would expect more reliable results from using the historical standard deviation. The ratio of the measurement system variation to the process variation calculated from historical data is called the percent process shown in the gage evaluation table. The general specification on percent process (less than 30%) is the same as that for percent study variation. When reducing the number of parts below 10, entering a historical standard deviation and focusing on percent process instead of percent study variation is strongly recommended. In this way, the size of the study can be reduced without concern that the quality of the results has been compromised. In this case, we see that the percent process and percent study variation are nearly equal. Therefore, our conclusions remain the same.
Actionable Conclusions
The Expanded Gage R&R study has provided a comprehensive assessment of the measurement system for the photoresist thickness measurement. With the number of distinct categories = 5, the system meets the minimum acceptance criteria for a measurement used to study the process. Since gage and the wafer*gage interaction were the strongest contributors to the measurement variation, determining the cause of the differences between gages, particularly for certain parts, will reduce overall measurement system variation. The within gage repeatability also was a reasonably large source of variation. Identifying ways to make the gage more repeatable also will reduce variation in the system.
As we have seen, a standard Gage R&R cannot adequately assess the capability of many measurement systems. When a standard study is not enough, an Expanded Gage R&R is an ideal tool to comprehensively characterize your measurement system.
|
TECH TIPS
|
Looking for a reprint of this article?
From high-res PDFs to custom plaques, order your copy today!


