If you can’t trust your data, there’s no point analyzing it—that’s why so many quality improvement projects include measurement system analysis, or MSA. The most common MSA is the Gage Repeatability and Reproducibility (R&R) study, which assesses the amount and sources of variation in your measurements.
The standard approach to Gage R&R is so pervasive, we rarely question it:
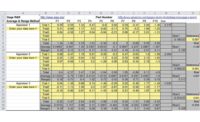
Take 10 parts and have three operators measure each two times.
But we wondered how accurate an assessment you can get using just 10 parts. To find out, we simulated 1,000 Gage R&R studies with the following characteristics:
No operator-to-operator differences, and no operator*part interaction.
Measurement system variation with a Contribution of 5.88%, between the popular guidelines of <1% being excellent and >9% being poor.
TECH TIPSThe most common measurement system analysis is the Gage Repeatability and Reproducibility (R&R) study, which assesses the amount and sources of variation in your measurements. There are several ways to get more insight from your gage study, such as calculating confidence intervals. In addition, if your study is verifying an established measurement system, use the historical standard deviation to estimate variance rather than relying solely on a small sample. |
Here is the distribution of results: See figure 1.
Contribution for the measurement system variation averages around the true value (5.88%). However, it’s highly skewed; many simulations had Contribution at twice or more its true value. And the variation is huge—about 25% of these simulated systems would have (incorrectly) failed.
So how many parts would a more accurate assessment of Contribution require?
When we simulated 1,000 studies using 30 parts, and then 100 parts, again with three operators measuring each part two times, the mean remained centered. That’s good…but how did more parts affect skewness and variation? See figure 2.
They decreased, but not that much. That’s because %Contribution is also affected by estimates of repeatability and reproducibility, so using more parts only tightens this distribution a limited amount. Consequently, even using 30 parts—an enormous undertaking, in practical terms—results in failure 7% of the time!
Operators
What about increasing operators instead of parts? We simulated 1,000 studies with four operators, 10 parts, and two replicates (for 80 runs). Then we simulated another 1,000 with four operators and two replicates, but reduced parts to eight to approximate the original experiment size (64 runs, compared to the original 60).
Let’s compare the standard experiment and these four-operator scenarios: See figure 3.
Clearly, using more operators doesn’t mean better results. Four operators and 10 parts offered little improvement over the standard study, and using four operators with eight parts increased variation in Contribution.
Replicates
Could increasing replicates work? We simulated 1,000 studies with three instead of two replicates, 10 parts, and three operators. Then we simulated studies with three replicates and operators, but reduced parts to seven to approximate the original experiment size.
Compare the standard to these three-replicate scenarios: See figure 4.
Using more replicates doesn’t mean better results, either. Three replicates with 10 parts yields no improvement, and three replicates with seven parts increases variation.
The bottom line? If you can collect more data, measuring additional parts is your best choice for reducing skewness and variation in Gage R&R.
Sampling Parts
But how do you select those parts?
If you answer with more than a few words—you could use just one—you may be making a popular but very bad decision. Do these ideas sound familiar?
Sample parts at regular intervals across the typical range of measurements.
Sample parts at regular intervals across the process tolerance (lower to upper spec).
Sample randomly, but pull one part from outside of each spec.
If so, brace yourself: Answer 1 is wrong. Answer 2 is wrong. And so is Answer 3.
Why? Because the statistics used to qualify a measurement system are all reported relative to the part-to-part variation, and these sampling schemes do not accurately estimate that variation.
The best answer for how to sample parts? Randomly.
We simulated more Gage R&R studies using the standard 10-part, three-operator, two-replicate design. One set of 1,000 simulations used 10 randomly selected parts. We also simulated these schemes:
An exact sampling of parts from the 5th to 95th percentiles of the underlying normal distribution.
Uniform selection across a typical range from the 5th to the 95th percentile.
Uniform selection across the spec range (assume a centered process with Ppk = 1).
Eight randomly selected parts, plus one part that falls half a standard deviation outside of each of the specs.
Here’s the distribution of the simulated “random” studies. See figure 5.
Some practitioners maintain that random sampling pulls parts that don’t match the underlying distribution. So how would it look if we could magically select 10 parts that follow the distribution almost perfectly, eliminating the effect of randomness? See figure 6.
The “exact” sampling shows much less skewness and variation, and is considerably less likely to incorrectly reject the measurement system. Clearly, random sampling has a big impact on %Contribution.
Unfortunately, obtaining an “exact” sample is usually impossible. If you don’t yet know how much measurement error you have, you can’t know if you’re pulling an exact distribution. It’s a statistical version of the-chicken-and-the-egg!
Sampling across a Typical Range or Specs
Compare the random sample to uniform sampling across a typical range of values from the 5th to the 95th percentile: See figure 7.
Variation is reduced, but we also see a very clear bias. Pulling parts uniformly across the typical range yields more consistent estimates, but those estimates are likely telling you that the measurement system is much better than it really is.
How about uniform collection across the spec range (assuming a centered process with Ppk = 1)? See figure 8.
This results in an even more extreme bias, one that guarantees qualifying this measurement system as good—perhaps even excellent!
Needless to say, collection across the spec range does not give an accurate assessment.
Sampling Outside the Spec Limits
Finally, how about taking parts randomly, except for one part pulled from just outside of each spec limit? Two points from outside the limits shouldn’t make a substantial difference, right? See figure 9 .
In fact, those two points render the results meaningless! This process had a Ppk of 1; a higher-quality process would make this result even more extreme.
The simulations prove that random sampling is the best option for sampling parts in a Gage R&R. The “exact” method would provide better results, but it requires that you already know the underlying distribution, and that you can measure parts accurately enough to ensure you’ve pulled the right ones.
If you have lingering concerns about your sample reflecting the underlying distribution, look at the average measurement for each selected part and verify that the distribution seems reasonable. If your sample shows unusually high skewness, you can always randomly select some additional parts to supplement the original experiment.
Two Ways to Get More Insight from Your Gage Study
How can you be confident you’re getting usable insight using Gage R&R?
First, calculate confidence intervals. This won’t improve the wide variation of estimates, but it does reveal how much uncertainty your estimates have. Consider this output: See figure 10.
You might accept this system based only on the Contribution being less than 9%...but with a 95% CI of (2.14, 66.18), you can make a more informed decision.
Second, if your study is verifying an established measurement system, use the historical standard deviation (SD) to estimate variance rather than relying solely on a small sample. Statistical software makes it easy to use your historical SD: See figure 11.
Your output will include a column called Process. This is the equivalent of the %StudyVar column, calculated using the historical SD instead of the sample SD: See figure 12.
Study Var and Process for Total Gage R&R can be interpreted similarly to Contribution, but use 10% and 30% cut-offs instead of 1% and 9%.
It might not be perfect, but the standard Gage R&R approach is a powerful tool for measurement system analysis, especially if you use random sampling to pull parts for your study, consider the confidence intervals for Contribution, and look at %Process for established systems.


