Home » Keywords: » control charts
Items Tagged with 'control charts'
ARTICLES
Software
If there are common causes of variability and the product is not meeting customer needs, process improvements are needed to improve the product quality.
Read More
Best Practices When Implementing SPC Charts
Control charts should be implemented carefully. Here are best practices to keep in mind.
July 13, 2022
Sponsored Content
Detect Small Shifts in the Process Mean with Exponentially Weighted Moving Average (EWMA) Charts
Quickly detecting small shifts in mature or highly sensitive processes is where the EWMA control chart really shines.
February 7, 2022
Control Charts 101
Control charts are straightforward tools that help operators understand process variability. They do this by identifying four process states.
January 7, 2022
The Past is Here
Before you leap forward into another eventful year, let's look back.
January 8, 2020
The Cost of a Poor Measurement System
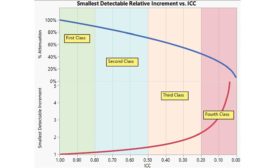
Convince people of the value of measurement system analysis.
July 1, 2017
Stay in the know with Quality’s comprehensive coverage of
the manufacturing and metrology industries.
eNewsletter | Website | eMagazine
JOIN TODAY!Copyright ©2025. All Rights Reserved BNP Media.
Design, CMS, Hosting & Web Development :: ePublishing


