Home » Keywords: » Pareto principle
Items Tagged with 'Pareto principle'
ARTICLES
Speaking of Quality | Jim Spichiger
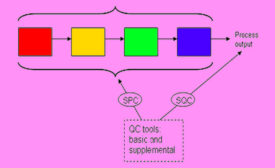
ASQ identifies the basic quality tools as: data collection sheets, histograms, Pareto charts, scatter diagrams, cause and effect diagrams, flow charts/process maps, and control charts.
Read More
Sponsored Content
Electronics Maker Uses Monte Carlo Simulation to Find Better Specs for Suppliers and Realize Significant Cost Savings
Monte Carlo Simulation uses a mathematical model of the system, and the simulation provides expected values based on an equation defining the relationship between the inputs and outputs.
February 14, 2022
Face of Quality
Quality Theories Help Maximize Results
The TLF and the Pareto Principle Can Be of Significant Value
July 1, 2016
Stay in the know with Quality’s comprehensive coverage of
the manufacturing and metrology industries.
eNewsletter | Website | eMagazine
JOIN TODAY!Copyright ©2024. All Rights Reserved BNP Media.
Design, CMS, Hosting & Web Development :: ePublishing


