How to Add Dynamic Measurement Uncertainties to Any Metrology Software
Changing the approach to measurement uncertainties allows software systems and users to share the same resources.


Over the years we have had numerous conversations related to the lack of standards and flexibility when it comes to calibration software. While other industries have devised methods to exchange data, the metrology world has been sitting on the bench. But rather than complain about it, we decided to do something about it starting with measurement uncertainties.
TECH TIPSThe concept of an uncertainty calculator required a slight change in perception in what an uncertainty calculator is at the core. Metrologists tend to see the result of an uncertainty calculation, the calculator and data used to make the calculation as a single tightly bonded entity. This archetype is largely due to the tradition of viewing a lab’s resulting best uncertainties as a fixed result, as opposed to a formula and data approach. |
Two years ago, Cal Lab Solutions and Spark Calibration Services in Turkey, with support from Middle East Technical University-Ankara Turkey (METU) and TÜBİTAK UME (Turkish National Metrology Institute- Gebze), mapped out the features of a System-of-Systems communication specification for the metrology world. The goal was to create a standardized method of communication that would facilitate the interaction and reusability of existing metrology software systems. The problem faced by Cal Lab Solutions and many other calibration labs around the world was duplication of data in different siloed systems.
Leveraging from other systems, we modeled our solution on well-defined industry standards. The analogy we use to explain how this all works is “Imagine your uncertainties calculations working like Orbitz!” You enter information about the measurement and standards being used and the system will sort and filter all the uncertainty calculators for you. Then by selecting the calculator that best fits the measurement and feeding in the data about the measurement, it calculates the expanded uncertainties, providing a detailed budget for that measurement.
The Problem:
Over the years, we have heard the same problem stated many different ways from many different customers. It starts with an auditor finding a measurement uncertainty listed on the calibration results that is lower than the lab’s accreditation. The big picture problem is the lack of hard connections among all the uncertainty calculations used in a calibration lab, from the ones used for the scope of accreditation down to the automated software. Each of them is different and can produce different results.
The Solution:
To solve this problem, we had to overcome several technical and perception issues related to uncertainty calculations. The interface must work for all metrology disciplines supporting complex as well as simple calculations. It had to support multiple ways of calculating uncertainties to include Microsoft Excel, because much of the industry’s uncertainties are based on spreadsheets. It had to have an auditable history trail with digital signatures. But most important, it had to allow both technicians and automated software systems easy access to all the uncertainty calculations.
Calculators:
The concept of an uncertainty calculator required a slight change in perception in what an uncertainty calculator is at the core. Metrologists tend to see the result of an uncertainty calculation, the calculator and data used to make the calculation as a single tightly bonded entity. This archetype is largely due to the tradition of viewing a lab’s resulting best uncertainties as a fixed result, as opposed to a formula and data approach. When we step back and look at the problem in blocks, we can see that data coupled with a formula calculates the result (three very distinct blocks!). Changing the data changes the results, but the formula remains fixed!
Calculators in Metrology.NET are implemented as complex data driven formulas. Just like in Ohm’s Law where (V = I * R), if the values for both I & R are provided, the calculator will compute resulting V. Our uncertainty calculators function the same way; the metrologist defines the formula along with the required inputs (both required and optional). When the values are set, the calculator is able to return the correct results every time.
Interface:
Once the formula based calculator was created, we needed a standard interface, allowing for communication across all metrology disciplines. We chose to use Name Value Pairs, so if you passed the calculator “I=0.5, R=24,” the calculator would return 12. Pretty simple!
Implementation:
In the following example, we demonstrate how to take an existing Microsoft Excel uncertainty budget, convert it to Metrology.NET and then call the REST Service from VB.NET. We choose to use REST, Representational State Transfer, because it is well-known, well-defined industry standard. REST based software architectures allow for both platform independence and scalability. In our example, we will be using VB.NET, but it is important to note REST Service can be called from several different programming languages.
Example:
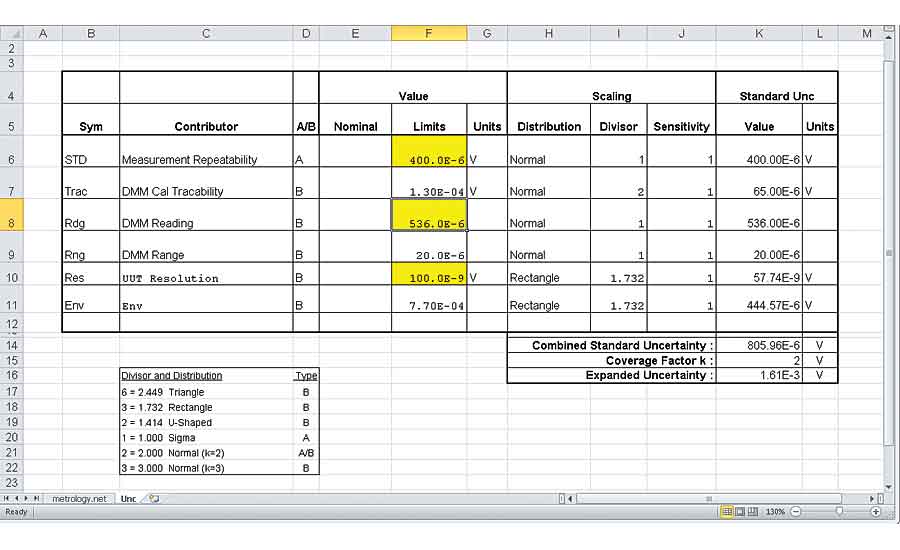
Our example is based on an HP 3458A making a 0.67 Volt measurement at 100 kHz. The below measurement uncertainty budget includes the 3458A’s published specifications, calibration traceability, measurement repeatability and UUT Resolution and is A2LA compliant.
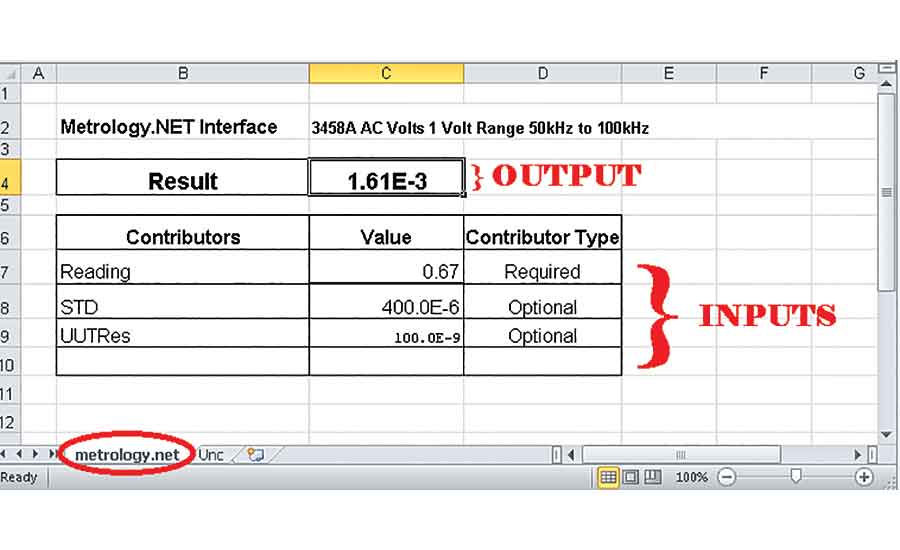
To integrate a spreadsheet into Metrology.NET, a formatted Metrology.NET tab must be inserted as shown below. This tab serves as the interface linking the INPUT / OUTPUT of the custom spreadsheet.
The INPUTS, called Contributors, define the external variables required for the calculation. In this example, Reading from the HP 3458A is required, while the (STD) Standard Deviation of the measurements and (UUTRes) resolution of the UUT is optional.
The INPUT values need to be linked to uncertainty budget section of the spreadsheet to allow the resulting uncertainty calculations to run dynamically. In this example, we have highlighted values on the Unc tab dependent on the data from the Metrology.NET tab. In the STD row, cell 6F is set to “=metrology.net!C8” meaning it will pull the value directly from the Metrology.NET tab’s C8 cell. The same is true for the F10 cell’s setting of “=metrology.net!C9.” But the Rdg row is a little different; here using the HP 3458A’s published specifications, we have to take the reading and multiply it by 0.08%. We set the F8 cell to “=metrology.net!C7*0.08%,” thus automatically calculating the uncertainty of the DMM’s reading as its contribution to the uncertainty budget.
We then have to link the Metrology.NET tab to the result of the uncertainty calculation. We set the Metrology.NET tab’s C4 cell to “=Unc!K16.” At this point, we can test the calculator’s accuracy by manually changing the Contributors / INPUTS on the Metrology.NET tab, while watching the Result / OUTPUT being automatically updated.
When the custom spreadsheet calculator is updated and operating properly, it can then be uploaded to the server. To do this, login on the server and select “Calculator” from the top menu, then scroll to the bottom of the page and click on “New Calculator.”
When prompted with a pop-up dialog, the Name and Type must be entered at a minimum. Though other calculator formats are supported, this example will only cover spreadsheets.
Next, the system will prompt you for more information about the uncertainty calculator and for the spreadsheet to be uploaded. Methodology, Assumption, Refs and Notes are all free form text fields; the data entered in these fields will be used as part of the catalog and indexing of the specific uncertainty budget. The goal here is to provide more specific information about the uncertainty calculator to users and auditors. The “Choose File” button is used to select and upload the spreadsheet calculator, and the “Export Sheet” button will download it from the server. “Save Changes” will save all changes to the server and increment the version number.
Next, we will add some parameters related to the calculator we just created. These parameters are name value pairs used to filter this specific uncertainty calculator from all other calculators in the system. Unlike the INPUT parameters, here the names don’t have to be unique; this allows us to apply the same calculator to the HP, Agilent and Keysight 3458A. Parameters can also be defined with a numeric range between a minimum and/or maximum value. There is no limit to the number of parameters that can be associated with a calculator.
Using the system to calculate uncertainties is simple. Select “Calculator” on the main menu, then select a filter parameter from the drop down, enter a value and press Filter. In this example, we filtered on Manufacturer= Keysight, Model= 3458A, Volts= 0.67 and Frequency= 100E3. Then select the calculator you want to use.
When the Calculator is loaded, the user has to simply enter the Reading, STD, UUTRes and press “Re-Calculate Uncertainty.” In this example, the reading as 0.670045 and the resulting uncertainty was 1.612 mV.
Above, we demonstrated using Web-Based-Frontend to calculate our uncertainties. Below lists sample code in VB.NET to perform the exact same calculation with the exact same result.
Conclusion
Moving to a System-of-Systems approach to measurement uncertainties allows software systems and users to share the same resources. Eliminating duplicated efforts saves time and money, while at the same time, increasing overall quality. In this example, we demonstrated how to migrate a custom spreadsheet based uncertainty budget into Metrology.NET. This enabled users to use the same uncertainty calculation from any web browser including iPads and Androids. It also enabled our VB.NET software to use the exact same calculator via a REST service call.
Looking for a reprint of this article?
From high-res PDFs to custom plaques, order your copy today!


