NDT | NDT in Aerospace
Flaw Detection in Aircraft Engine Fan Components using Automated Ultrasonic Technologies
As the number of flights is expected to keep increasing over the years, flaw detection is critical to safe air travels.

All Images Source: TecScan Systems and Adobe Stock
Ensuring the safety and reliability of aircraft components is paramount. With the ever-increasing demands for efficiency and performance, the integrity of these critical components cannot be compromised. Automated ultrasonic testing offers a high-resolution, nondestructive approach for detecting flaws such as cracks, porosities, delaminations, and other material irregularities with high repeatability and accuracy. By leveraging automation, 3D scanner motion control, and advanced data analysis, ultrasonic testing technology enhances inspection efficiency while minimizing human error. This article showcases the intricacies of Automated UT, emphasizing their role in flaw detection and inspection time reduction. Experimental UT tests were made on aero-engine fan blade and fan case samples to validate detectability and examine the challenges of inspecting such complex composite components.
Automated Ultrasonic Testing
Automated ultrasonic testing (AUT) and phased array ultrasonic testing (PAUT) technologies are widely used to inspect a broad variety of parts. AUT solutions present itself in different types, from portable scanners attached to a structure, to widely used UT immersion scanners, up to more advanced solutions such as water squirter gantry scanners, phased array testing, robotic arms and more. AUT offers many benefits when compared to manual scanning, namely improved accuracy and repeatability, reduced inspection time, early detection of flaws, and costs savings.
Ultrasonic C-Scan imaging is achieved by performing a raster scan on the inspected samples with appropriate ultrasonic transducers using any of these systems. Contour following and 3D scanning techniques are required when components with complex shapes and curvatures are involved. Immersion or Gantry Scanners are designed or retrofitted to achieve higher scanning speeds at high accuracy, they are well suited for the inspection of parts having complex and curved geometries.
Composite Fan Cases and Blades Inspection: Challenges
Composite fan blades and fan cases can be found in multiple examples of TurboFan engines such as Safran’s LEAP engines, General Electric’s GE9X engine, and Rolls Royce’s UltraFan demonstrator engine. The utilization of composite material in the conception of fan blades and fan cases reduces the overall weight of the fan engines and proved to increase engine efficiency, while reducing emissions and noise.


Fan blades are designed with a metal leading edge (MLE) which is bonded to composite part of the blade to improve impact damage resistance in the event of a bird strike, as well as to protect blades against erosion which is detrimental to turbine efficiency. While titanium is often used for the MLE, other metals such as steel alloys are used as the MLE on blades of some Turbofan models such as the GE9X. In either case, bond quality must be verified to prevent disbonding of the MLE during flight. Fan cases must also be evaluated for flaws such as delaminations or porosity.
The main challenge of automated scanning of fan blades resides in their complex shape and material composition. Ultrasounds must be transmitted through one or two layers of metal and one layer of composite material, all of which typically have unparallel surfaces and thicknesses that vary along the blade. Selecting the proper reference to calculate probe trajectories must therefore be done with care in order to ensure optimal sound transmission and coverage through the part. This also causes the ultrasonic response to vary naturally across the blade surface, resulting in a challenging analysis.
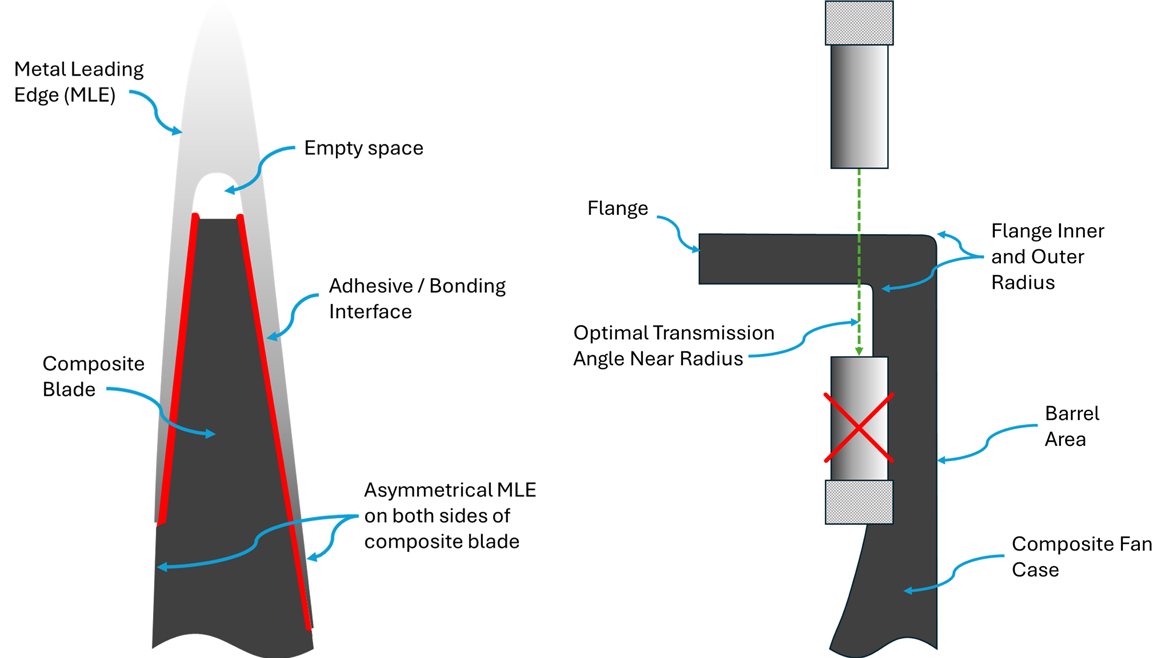
Composite fan cases share similar geometrical challenges as fan blades (varying thicknesses, unparallel surfaces), however the inspection of flanges and around the flange radii poses a more complex problem; the small flange curvature radius is the source of mechanical interferences between the ultrasonic probe and the fan case, which must be taken into account in probe trajectories.
Automated UT: Inspection Results
Examples of automated 3D ultrasonic scans were performed on fan blade and fan case samples in a through-transmission setup. Rectangular pieces of foam, folded Teflon and other types of tapes were applied on the external surfaces of the sample parts to simulate flaws.
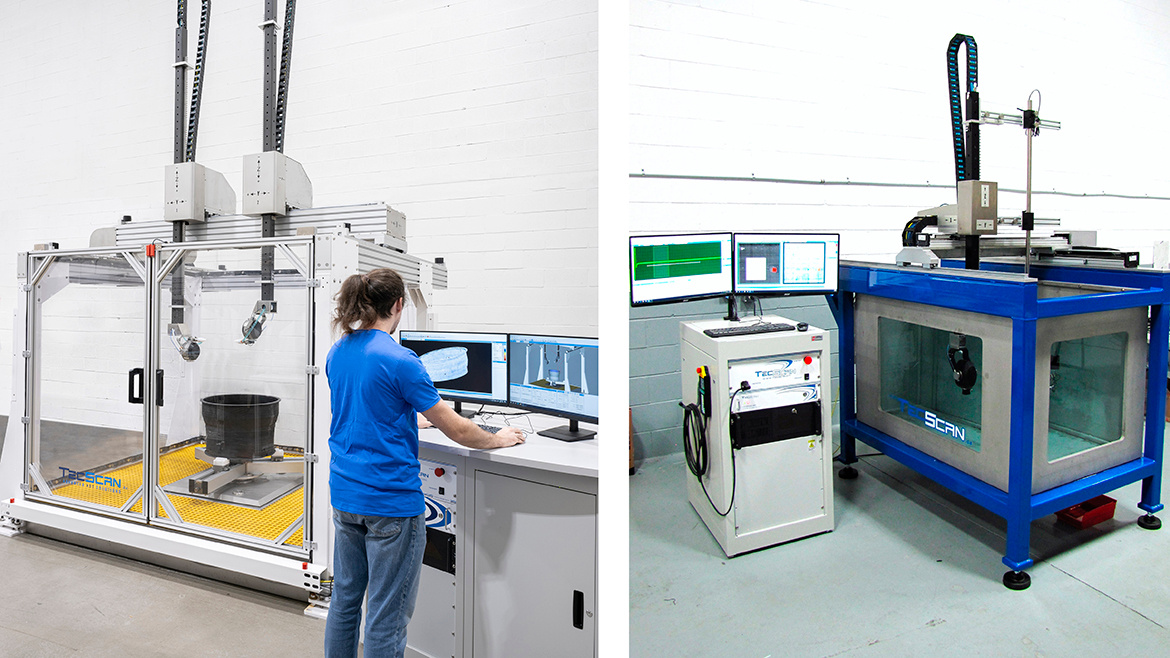
A 10-axis immersion scanner with two independent axes assemblies (X, Y, Z, gimbal/gimbal) was used to scan the fan blade sample. This setup allows you to follow complex shapes with both the emitting and transmitting probes and minimizes risks of mechanical interference with the blade. Alternatively, a 5-axis scanner terminated by a U-shaped probe holder holding both probes could be used, provided that the optimal transmission is obtained from a permanent probe alignment. However, such a setup adds an important payload to the gimbal/gimbal manipulator, adds risks of mechanical interferences with the blade, as well as being less flexible for water path and beam angle adjustments.
The preparation of the probes trajectories starts with the CAD representation of the part. In the example presented here, the midplane of the blade section covered by the pressure and/or suction sides of the MLE is used to generate trajectories. Since the MLE is not necessarily symmetrical on both sides of the composite blade, three situations can occur in the transmission of the ultrasonic waves: propagation across the blade and (1) the MLE on the suction side, (2) the MLE on the pressure side, and (3) the MLE on both sides. This, combined with the varying curvature and thickness of the part causes the expected signal amplitude to vary considerably across the scanned surface.


The image below shows a comparison of two scans performed at the same water path and entry angle, however with different probes. Fig. 5 (a) shows the 3D representation of the C-Scan obtained using a pair of flat, 0.5” diameter transducers (2.25MHz), while Fig. 5 (b) was obtained with a pair of spherically focused transducers (F = 2”) with a diameter of 0.75” (2.25MHz).
The test conducted with the flat transducers clearly illustrates the challenge of such a part. The attenuation caused by the internal structure as well as from the varying thickness can be observed on the C-Scan. As an example, the section on the far left corresponding to the thicker root section presents a signal attenuation similar to those from artificial indications. In addition, some indications are barely visible when compared to the result with focused probes, and their shape is not well defined. Focusing on the emitting and receiving side results in well-defined points of entry and exit in the part, thus creating a narrow beam inside the part. This explains the increased contrast observed between flaws and the part background, on Fig, 5 (b).


Even if the C-Scan obtained with focused transducers shows better contrast across the blade, it still exhibits differences in attenuation of approximately 11dB between the thinner tip of the blade and the thicker root. This means that a local analysis based on natural signal variation around of the flaws must be conducted to properly detect and characterize indications.
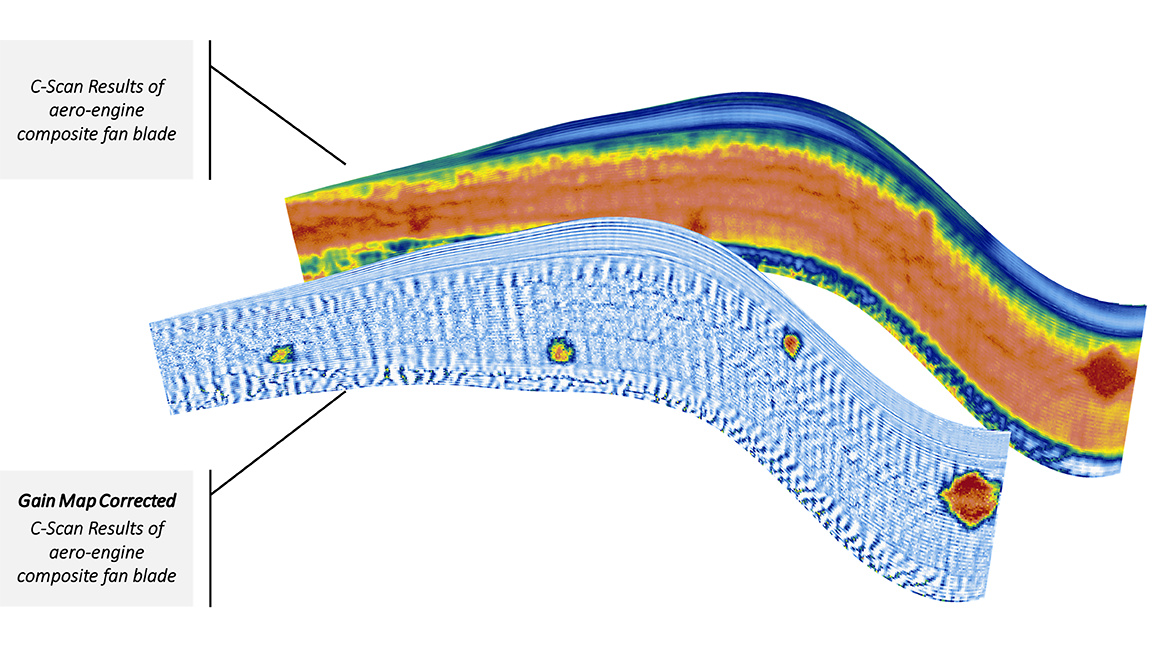
The C-scan results can be substantially improved using automated gain correction. This approach uses a gain variation map of the blade built from scans recorded on one or multiple reference blades to perform position-based gain adjustments during the scan. Fig.6 shows two C-Scan images acquired on the same blade, with (front) and without (back) gain map correction. As seen here, a much better SNR is obtained from this dynamical gain correction.
As presented earlier, it is the detection around the flange radius that is most challenging when dealing with fan cases. It is by defining an independent trajectory for the emitting and receiving transducer at angles that prevent collisions while ensuring ultrasonic transmission that a fan case can be scanned. This generates signal loss around the flange that can then be corrected by GCM.


Conclusions
As the number of flights is expected to keep increasing over the years, flaw detection is critical to safe air travels. Ultrasonic testing has proven to be able to detect multiple types of flaws in materials. Automated ultrasonic testing proved to be a leap forward in terms of reliability, repeatability, as well as time and cost efficiency. With the increasing use of composite materials in the fabrication of aircrafts components and their ever-evolving complexity, advanced testing solutions such as 3D ultrasonic scanning are becoming essential tools for the aviation industry, as demonstrated for recently developed composite fan blades and cases.
Looking for a reprint of this article?
From high-res PDFs to custom plaques, order your copy today!


